Performance laboratory

JARVIS Bench

The project’s measured history. Not a leaderboard and not a comparison with other assistants: only numbers that were recorded on the owner’s machine or in the project’s test runs, each with its date, evidence type and source.

Recorded values
184
Metrics
104
First reading
28 Jul 2026
Latest reading
22 Sept 2026

How to read this page. Marker shapes show where each number came from: circles are measured or observed on the real machine, squares are test runs, diamonds are calculations or simulations. Nothing here is live telemetry; every value is a past recording. All readings come from one desktop (AMD Ryzen 9 9900X, 12 cores, NVIDIA GeForce RTX 5070, 12 GB VRAM, 32 GB system RAM). Numbers are not comparable across different test definitions. Methodology

Bay 01

Milestone stories

What changed, measured before and after.

Conversation turn latency, p50, across two optimisations

Baseline, pre-optimisation 3,083 Acknowledgement no longer blocks … 1,723 Plus task-relevant tool projection 1,270
Scale: ms.

Two changes on 11 September: the acknowledgement stopped blocking the provider call, then only task-relevant tools were offered to the model. Median turn time fell from 3.08 s to 1.27 s.

Test: Latency Lab (tools/latency/lab.py): 21 scripted journeys (status, time, recall, project, hud, latency, chat; three passes) through the normal launcher; end of input to end of turn.

Capabilities proven live at each census

Then 75 capabilities 28 Jul 2026 Now 9 capabilities 20 Sept 2026

  • measured or observed
Show the numbers
Capabilities proven live at each census
Date Value Evidence Revision Samples Note
28 Jul 2026 75 capabilities OBSERVED 01ed5c7b8 304 JARVIS only counts a capability as LIVE while fresh runtime evidence exists — the number going down reflects a stricter truth rule, not lost features.
28 Jul 2026 256 capabilities OBSERVED 4e70347c7 341 JARVIS only counts a capability as LIVE while fresh runtime evidence exists — the number going down reflects a stricter truth rule, not lost features.
29 Jul 2026 153 capabilities OBSERVED 918420e6f 341 JARVIS only counts a capability as LIVE while fresh runtime evidence exists — the number going down reflects a stricter truth rule, not lost features.
6 Aug 2026 145 capabilities OBSERVED dcd7b6ef3 341 JARVIS only counts a capability as LIVE while fresh runtime evidence exists — the number going down reflects a stricter truth rule, not lost features.
6 Aug 2026 18 capabilities OBSERVED c2e0b128a 341 JARVIS only counts a capability as LIVE while fresh runtime evidence exists — the number going down reflects a stricter truth rule, not lost features.
7 Aug 2026 24 capabilities OBSERVED ad616aed1 341 JARVIS only counts a capability as LIVE while fresh runtime evidence exists — the number going down reflects a stricter truth rule, not lost features.
6 Sept 2026 21 capabilities OBSERVED fcc7df48f 341 JARVIS only counts a capability as LIVE while fresh runtime evidence exists — the number going down reflects a stricter truth rule, not lost features.
9 Sept 2026 9 capabilities OBSERVED ed77b2af5 341 JARVIS only counts a capability as LIVE while fresh runtime evidence exists — the number going down reflects a stricter truth rule, not lost features.
20 Sept 2026 9 capabilities OBSERVED 2ea210950 342 JARVIS only counts a capability as LIVE while fresh runtime evidence exists — the number going down reflects a stricter truth rule, not lost features.

The count fell from 256 to 9 because the definition of LIVE became stricter (a real booted process, a real port, no test doubles, evidence on disk, expiring after 24 hours), not because features were removed.

Test: Count of registered capabilities whose LIVE state is backed by a current (unexpired) probe receipt obtained by asking the running process; 304 capabilities registered.

Local LM: transfer passes across one campaign’s checkpoints

Transfer at update 24 29 Transfer at update 48 36 Transfer at update 72 32 Transfer at update 93 32
Scale: passes of 40, out of 40.

Passes rose and then fell as training continued: evidence of interference rather than steady learning.

Test: Frozen 40-case TRAIN-derived transfer diagnostic on the update-24 checkpoint (8 FAIL).

Bay 02

Build quality

How the test suite and the project’s own quality gates have moved over time.

Full test suite: tests passing

Then 9,949 tests 16 Aug 2026 Now 23,588 tests 17 Sept 2026 improved

  • measured or observed
Show the numbers
Full test suite: tests passing
Date Value Evidence Revision Samples Note
16 Aug 2026 9,949 tests MEASURED 5d76fa7f9 10162 9,949 of 10,162 tests passed in the full-suite run on 2026-08-16.
20 Aug 2026 10,771 tests MEASURED 0486a5c89 10971 10,771 of 10,971 tests passed in the full-suite run on 2026-08-20.
29 Aug 2026 14,589 tests MEASURED 926366a98 14648 14,589 of 14,648 tests passed in the full-suite run on 2026-08-29.
1 Sept 2026 15,409 tests MEASURED e1d230e6f 15569 15,409 of 15,569 tests passed in the full-suite run on 2026-09-01.
6 Sept 2026 16,666 tests MEASURED 47b98385c 16874 16,666 of 16,874 tests passed in the full-suite run on 2026-09-06.
9 Sept 2026 20,614 tests MEASURED 4aaaaeafa 20634 20,614 of 20,634 tests passed in the full-suite run on 2026-09-09.
13 Sept 2026 21,246 tests MEASURED bdf9bf490 21520 21,246 of 21,520 tests passed in the full-suite run on 2026-09-13.
17 Sept 2026 23,588 tests MEASURED bb54722e0 23984 23,588 of 23,984 tests passed in the full-suite run on 2026-09-17.

Test: Complete pytest run via the project's suite runner in a fresh worktree (timeout 300 s per test); 10162 tests collected.

Full test suite: failures and errors

Then 146 tests 16 Aug 2026 Now 311 tests 17 Sept 2026 worse

  • measured or observed
Show the numbers
Full test suite: failures and errors
Date Value Evidence Revision Samples Note
16 Aug 2026 146 tests MEASURED 5d76fa7f9 10162 146 failing/erroring tests were recorded honestly on 2026-08-16 rather than skipped.
20 Aug 2026 132 tests MEASURED 0486a5c89 10971 132 failing/erroring tests were recorded honestly on 2026-08-20 rather than skipped.
29 Aug 2026 52 tests MEASURED 926366a98 14648 52 failing/erroring tests were recorded honestly on 2026-08-29 rather than skipped.
1 Sept 2026 92 tests MEASURED e1d230e6f 15569 92 failing/erroring tests were recorded honestly on 2026-09-01 rather than skipped.
6 Sept 2026 137 tests MEASURED 47b98385c 16874 137 failing/erroring tests were recorded honestly on 2026-09-06 rather than skipped.
9 Sept 2026 2 tests MEASURED 4aaaaeafa 20634 2 failing/erroring tests were recorded honestly on 2026-09-09 rather than skipped.
13 Sept 2026 192 tests MEASURED bdf9bf490 21520 192 failing/erroring tests were recorded honestly on 2026-09-13 rather than skipped.
17 Sept 2026 311 tests MEASURED bb54722e0 23984 311 failing/erroring tests were recorded honestly on 2026-09-17 rather than skipped.

Failures are recorded, not skipped. The count rises when new tests land faster than fixes, and part of each reading was later traced to worktree-only artefacts.

Test: Same run: failed tests plus collection/setup errors (107 failed, 39 errors) of 10162 collected.

Repository quality gates passing

Then 22 gates 3 Aug 2026 Now 27 gates 17 Sept 2026 improved

  • measured or observed
Show the numbers
Repository quality gates passing
Date Value Evidence Revision Samples Note
3 Aug 2026 22 gates MEASURED 0e9e0baef 22 22 of 22 automated quality gates passed on 2026-08-03.
25 Aug 2026 25 gates MEASURED 227914ade 25 25 of 25 automated quality gates passed on 2026-08-25.
9 Sept 2026 28 gates MEASURED 56b23ad45 28 28 of 28 automated quality gates passed on 2026-09-09.
17 Sept 2026 24 gates MEASURED b4d5d9c5 28 24 of 28 automated quality gates passed on 2026-09-17.
17 Sept 2026 27 gates MEASURED 787aea26 28 27 of 28 automated quality gates passed on 2026-09-17.

The gate set grew from 22 to 28. The dip on 17 September is a new mutation-testing gate that had not yet been run on that revision.

Test: Registered automated gates (secret scans, egress, orphan/binding checks, proof re-runs, mutation ratchet, etc.); 22 gates registered at the time.

Tier 1 mutation kill rate

Then 51.8% 30 Aug 2026 Now 73% 18 Sept 2026 improved

  • measured or observed

project target 90%

Show the numbers
Tier 1 mutation kill rate
Date Value Evidence Revision Samples Note
30 Aug 2026 51.8% MEASURED caec91cb 527 Share of deliberately injected bugs that the test suite catches.
11 Sept 2026 72% MEASURED fb174c77 583 Share of deliberately injected bugs that the test suite catches.
17 Sept 2026 73.5% MEASURED f02fd5e7 611 73.5% of 611 injected defects were caught across all 44 tier-1 modules.
18 Sept 2026 73% MEASURED 22ee5da8 611 Share of deliberately injected bugs that the test suite catches.

Test: tools/mutation/mutate.py over 38 tier-1 modules (up to 14 mutants each): killed 273 of 527.

Bay 03

Runtime and interface

Latency, HUD responsiveness and engineering solve times.

HUD input-to-visible latency, p95

Then 40.2 ms 8 Aug 2026 Now 5 ms 13 Sept 2026 improved

  • measured or observed
Show the numbers
HUD input-to-visible latency, p95
Date Value Evidence Revision Samples Note
8 Aug 2026 40.2 ms MEASURED 183c386f How quickly the HUD visibly responds to input, measured in the native window.
8 Sept 2026 4.1 ms MEASURED 172641b0 How quickly the HUD visibly responds to input, measured in the native window.
13 Sept 2026 5 ms MEASURED 6a5bc43f 60 How quickly the HUD visibly responds to input, measured in the native window.

Test: tools/hud/shell_performance.py: control input to changed visible geometry, viewport width 1600px.

Reflex lane first audio, p50

Then 82.1 ms 20 Aug 2026 Now 403.5 ms 17 Sept 2026 worse

  • measured or observed

budget p95 300 ms

Show the numbers
Reflex lane first audio, p50
Date Value Evidence Revision Samples Note
20 Aug 2026 82.1 ms MEASURED 28fc5cb6 80 Successive readings of the instant-answer lane's time to first sound, each checked by a planted-delay control.
12 Sept 2026 395.2 ms MEASURED 5e8175f2 16 Successive readings of the instant-answer lane's time to first sound, each checked by a planted-delay control.
17 Sept 2026 403.5 ms MEASURED e00c6f1b A quick acknowledgement starts playing in about 0.4 s (fallback voice).

Readings from different voice paths are not directly comparable; each point names its path.

Test: tools/probes/probe_reflex_first_audio.py: wall clock from return of the injected transcribe callable to the real speaker's first audio write.

Spoken engineering calculation, turn latency

Then 3,879 ms 8 Sept 2026 Now 6,230 ms 10 Sept 2026 worse

  • measured or observed
Show the numbers
Spoken engineering calculation, turn latency
Date Value Evidence Revision Samples Note
8 Sept 2026 3,879 ms MEASURED 4e90787c 1 Time for JARVIS to take a spoken engineering question and answer it with a verified calculation.
9 Sept 2026 5,946 ms MEASURED 4d47ca43 1 Time for JARVIS to take a spoken engineering question and answer it with a verified calculation.
10 Sept 2026 6,230 ms MEASURED 4aaaaeaf 1 Time for JARVIS to take a spoken engineering question and answer it with a verified calculation.

Test: tools/campaign/live_drive.py P14 engineering drive: spoken-style request to compare pressures on three plates; time to complete the turn.

CalculiX linear-static solve, daily median wall time

Then 0.377 s 16 Aug 2026 Now 0.926 s 18 Sept 2026 worse

  • measured or observed
Show the numbers
CalculiX linear-static solve, daily median wall time
Date Value Evidence Revision Samples Note
16 Aug 2026 0.377 s MEASURED 52 A reference finite-element solve runs in well under a second on this machine.
4 Sept 2026 0.597 s MEASURED 48 A reference finite-element solve runs in well under a second on this machine.
18 Sept 2026 0.926 s MEASURED 45 A reference finite-element solve runs in well under a second on this machine.

Test: Tensile-bar reference case (1 m steel cube, one C3D8 hex, hand-derivable answer) solved by CalculiX; median of the day's wall times from the engineering run ledger.

HUD fidelity self-assessment (mean of 12 categories)

Then 3.71 score (0–10) 30 Jul 2026 Now 2.43 score (0–10) 20 Sept 2026 worse

  • measured or observed

acceptance gate above 9.0

Show the numbers
HUD fidelity self-assessment (mean of 12 categories)
Date Value Evidence Revision Samples Note
30 Jul 2026 3.71 score (0–10) OBSERVED 58ca5e6aa 12 The HUD is graded against a deliberately harsh 9.0-per-category bar; independent rescoring lowered the score, and the gate is not yet met.
31 Jul 2026 4.83 score (0–10) OBSERVED fe0246c46 12 The HUD is graded against a deliberately harsh 9.0-per-category bar; independent rescoring lowered the score, and the gate is not yet met.
3 Aug 2026 2.94 score (0–10) OBSERVED c9ad1b641 12 The HUD is graded against a deliberately harsh 9.0-per-category bar; independent rescoring lowered the score, and the gate is not yet met.
7 Aug 2026 3.34 score (0–10) OBSERVED ad616aed1 12 The HUD is graded against a deliberately harsh 9.0-per-category bar; independent rescoring lowered the score, and the gate is not yet met.
20 Sept 2026 2.43 score (0–10) OBSERVED 2ea210950 12 The HUD is graded against a deliberately harsh 9.0-per-category bar; independent rescoring lowered the score, and the gate is not yet met.

An honest self-assessment against a demanding reference. It has not met its gate.

Test: Mean of twelve design/fidelity categories (cinematic hierarchy, density, originality, data truth, 3D depth, motion, etc.), scored 0–10; release gate requires every category strictly above 9.0.

End of speech to first answer audio, p50

Baseline, pre-optimisation 2,749 Plus task-relevant tool projection 1,107
Scale: ms.

Test: Latency Lab derived span speech_end_to_first_audio across all 21 journeys (reflex and cognition lanes).

On camera · 22 Sept 2026

Timed while being filmed

One booted session, requests typed into the running conversation. Each is a single turn (n = 1), so read them as what happened once, not as a typical value.

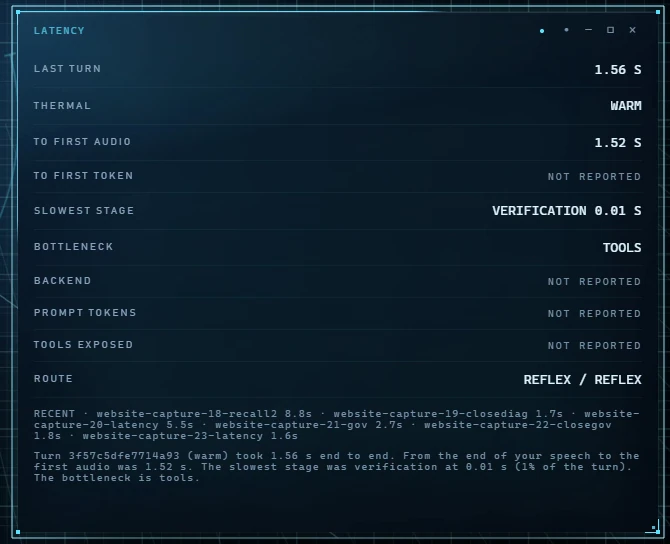
The HUD latency panel: last turn 1.56 s, first audio 1.52 s, slowest stage verification 0.01 s, bottleneck tools, route reflex.
Real capture, captured 22 September 2026. One typed reflex turn, measured by the conversation’s own marks: 1.56 s end to end.

Bay 04

Local model evaluation

Every local language model campaign measured against the same frozen gates. None passed. Production cognition uses a hosted model while this work continues. How the local model is trained

Local LM: release-blocking validation gate, by campaign

Base 3 Final-cp7-001 6 Bounded correction 4 Recovery001 5 Recovery002 5 Recovery003 3 Recovery004 5 Architecture001 (update 96) 8
Scale: cases passed, out of 26. every case must pass

No campaign came close to the gate. This is the core evidence behind the 21 September negative architecture decision.

Test: Fresh-process reload, 26 frozen validation cases (20 release-blocking) under the CP-7 contract; gate requires all blocking cases to pass.

Local LM: adversarial development gate, by campaign

Base 2 Bounded correction 2 Recovery001 2 Recovery002 2 Recovery003 2 Recovery004 3 Architecture001 (update 96) 5
Scale: cases passed, out of 25.

Test: 25 adversarial development cases (19 release-blocking), fresh-process generation.

Local LM: conditioned development battery, by campaign

Pilot2 104 Base 84 Final-cp7-001 103 Bounded correction 103 Recovery001 103 Recovery002 103 Recovery003 97 Recovery004 89 Architecture001 (update 96) 101
Scale: strict passes, out of 166.

Test: Strict passes on the 166 paired DEV items.

Local LM: transfer-diagnostic failures, by model and variant

Ministral preservation probe (q/v… 6 Ministral + extra exposure (16 up… 6 Ministral + MLP down-projection c… 3 Qwen3-14B untuned (non-thinking) 9 Qwen3.5-9B untuned (non-thinking) 17 Qwen3.5-9B adapter (16 updates) 9 Qwen3.5-9B adapter + exposure (48… 7 Gemma 4 12B untuned 8 Gemma 4 12B bounded adapter (eval… 9 Gemma 4 12B curriculum contrast (… 10 Gemma 4 12B 50/50 objective contr… 9
Scale: failures of 40, out of 40. gate: at most 4

Test: Frozen 40-case TRAIN-derived transfer diagnostic with actual output-bound independent semantic review; viability gate is at most 4 FAIL and zero critical FAIL.
Gemma 4 12B: mean exact-target loss while training

Gemma 4 12B untuned 3.95 Gemma 4 12B after 16 updates (ter… 2.35 Gemma 4 12B after 48 updates (exp… 0.859
Scale: nats per token.

Lower loss on the training targets (exact fit) did not produce passing transfer results. Fitting is not generalising.

Test: Mean negative log-likelihood of the 12 exact TRAIN targets (6 mechanism families × grounded/counterfactual).

Bay 05

All single readings

86 one-off measurements, grouped by area. A single reading shows what happened once, under the stated conditions.

Single benchmark readings
Measurement Value Evidence Date
Gemma 4 12B inference load time inside full-stack coexistence run boot time 57.1 seconds MEASURED
Relaunch to listening (with re-arm) boot time 41 s OBSERVED
Diagnostic core startup time boot time 9.88 s OBSERVED
Diagnostic core startup time boot time 10.7 s OBSERVED
Normal launcher startup with local voice and conversation (cycle 1) boot time 125.6 s OBSERVED
Normal launcher startup with local voice and conversation (cycle 2) boot time 37.3 s OBSERVED
Local voice worker cold load boot time 45 s OBSERVED
Verified browser target reads with restart browser grounding 2.81 s MEASURED
Browser navigation to public document (browser001) browser grounding 1.55 s OBSERVED
Browser navigation to public document (browser002) browser grounding 0.828 s OBSERVED
Research fetch latency (robots-permitted page) browser grounding 75.2 ms MEASURED
CAD hollow: cavity volume vs closed form (sphere) CAD ops / engineering calculations 1.49e-14 % relative error CALCULATION
Voice engineering calculation matched oracle CAD ops / engineering calculations 100% CALCULATION
Printer E-stop trip time CAD ops / engineering calculations 0.872 ms MEASURED
Engineering solvers reachable CAD ops / engineering calculations 3 solvers MEASURED
Advanced Systems atomic capabilities decomposed capability count 319 atomic capabilities OBSERVED
Live capabilities reached by a real round trip capability count 17 of 20 reached MEASURED
Mixed-application workflow actions verified computer task success 100% MEASURED
Long mission: file effects verified across restart computer task success 100% SIMULATION
Native apps semantically inspected and verified computer task success 3 apps MEASURED
Universal app operator: Calculator journey steps verified computer task success 100% MEASURED
Semantic control lookup time (Calculator) computer task success 249.1 ms MEASURED
Native input tokens — 'list files' synthetic request (15 tools, Gemma) context overhead 5,992 tokens MEASURED
Native input tokens — 'read the screen' synthetic request (3 tools, Gemma) context overhead 2,956 tokens MEASURED
Native input tokens — zero-evidence 'do it' fallback offering 138 tools (Gemma) context overhead 35,937 tokens MEASURED
Prompt tokens to offer the full 101-tool payload (Ministral) context overhead 20,975 tokens MEASURED
Prompt tokens after schema-preserving compaction (representative prompt) context overhead 14,561 tokens MEASURED
HUD reference occupancy ratio HUD performance 0.508 ratio MEASURED
HUD keyboard traversal findings HUD performance 0 findings MEASURED
HUD sustained frame rate on 240 Hz display (native shell) HUD performance 229.7 fps MEASURED
HUD 30-minute soak: memory growth slope HUD performance -144.4 MB/h MEASURED
HUD axe-core violations (worst view) HUD performance 0 violations MEASURED
HUD readability findings (small / clipped / low-contrast) HUD performance 0 findings MEASURED
HUD idle CPU (machine basis) HUD performance 0.078 % of machine MEASURED
HUD axe-core violations (worst view), regression reading HUD performance 1 violations MEASURED
Full-stack coexistence — whole-GPU peak (LM + ASR + voice + HUD + body + browser) inference coexistence 11,025,776,640 bytes MEASURED
LM v2 sealed post-SFT gate — pilot B whole-case pass LM evaluation 63 cases passed (of 124) MEASURED
Recall of a corrected fact after a real restart memory retrieval 100% MEASURED
Forgetting a fact on request (correct refusal to recall) memory retrieval 33.3% MEASURED
Hybrid retrieval top-1 accuracy on adversarial queries memory retrieval 100% MEASURED
Gemma 4 12B exposure continuation training — peak dedicated GPU resource utilization 9,824,735,232 bytes MEASURED
Architecture001 DEV generation — peak dedicated GPU resource utilization 10,529,382,400 bytes MEASURED
Qwen3-14B 4095+1-token inference smoke — allocator reserved resource utilization 8,472,494,080 bytes MEASURED
Qwen3.5-9B bounded adapter training — peak dedicated GPU resource utilization 10,500,022,272 bytes MEASURED
Gemma 4 12B 4,096-token chunked prefill — peak dedicated GPU resource utilization 8,717,430,784 bytes MEASURED
ASR dedicated GPU residency — float16 resource utilization 4,256,743,424 bytes MEASURED
ASR dedicated GPU residency — int8_float16 resource utilization 2,209,906,688 bytes MEASURED
Ministral-3-14B QLoRA training — peak reserved (final update) resource utilization 9,502,195,712 bytes MEASURED
Local image generation peak VRAM resource utilization 8.41 GB MEASURED
Local voice worker resident memory resource utilization 2.47 GB OBSERVED
GPU memory in use with the whole runtime resource utilization 6 GB OBSERVED
Ministral-3-14B NF4 inference load — allocator reserved resource utilization 9,881,780,224 bytes MEASURED
Typed reflex turn, end to end response latency 1.56 s MEASURED
Engineering solve turn (plan, solve, panel, answer) response latency 5.13 s MEASURED
Cited research turn (3 sources) response latency 19.9 s MEASURED
Typed “Emergency stop.” turn response latency 420 ms MEASURED
Qwen3.5-9B adapted — first final-answer token p95 response latency 939.5 ms MEASURED
Qwen3.5-9B adapted — sustained decode throughput response latency 18.1 tokens/s MEASURED
Ministral Architecture001 — validation generation throughput response latency 5.15 tokens/s MEASURED
First audio p95 with local C013 voice (acknowledgement) response latency 68.9 ms MEASURED
First synthesised answer audio with local voice (worst of three) response latency 2,481 ms MEASURED
Barge-in stop time with local voice (worst of three) response latency 27.6 ms OBSERVED
Local ASR decode median response latency 167.2 ms MEASURED
Hosted model first token p50 response latency 481.8 ms MEASURED
Hosted TTS first audio chunk p50 (warm) response latency 261 ms MEASURED
Cognition first-audio latency p50 response latency 1,846 ms MEASURED
Speech recognition latency — local GPU (Whisper large-v3, float16, beam 1) response latency 165 ms OBSERVED
Speech recognition latency — hosted transcription API (one real turn) response latency 2,479 ms OBSERVED
Protocol routine across process restart restart/recovery 100% MEASURED
Owned processes surviving a core crash restart/recovery 0 survivors MEASURED
E-stop settles all owned processes restart/recovery 374.7 ms MEASURED
First audio after restart with local voice restart/recovery 61.6 ms MEASURED
Gesture recogniser per-frame processing p95 spatial benchmark 11.2 microseconds SIMULATION
Gesture cancellation path p95 spatial benchmark 3.8 microseconds SIMULATION
Gesture primitive acquisition time (target 200 ms) spatial benchmark 166.7 ms SIMULATION
False gesture events on 1,800 jitter/rapid-pose negative samples spatial benchmark 0 events SIMULATION
Advanced memory integration tests passed test coverage 191 tests passed MEASURED
Mutation testing kill rate (cold inputs) test coverage 71.9 % mutants killed MEASURED
Commands in the frozen CP-7 model-visible contract tool discovery size 134 commands MEASURED
ASR precision screen: acceptance thresholds met voice evaluation 2 of 2 precisions passed MEASURED
Warm synthesis mean — C013 voice evaluation 1.31 seconds MEASURED
Voice synthesis GPU peak allocated — C013 voice evaluation 1,990 MiB MEASURED
Echo gate: speech passed during double-talk voice evaluation 96.5% MEASURED
End-of-utterance classifier balanced accuracy (owner corpus) voice evaluation 94.6 % balanced accuracy MEASURED
Finished utterances wrongly held voice evaluation 4 of 37 MEASURED
Mid-thought utterances cut off voice evaluation 0 of 11 MEASURED

Open instruments

What is not measured yet

  • ONE HUD rendering performance on the current surface is recorded as not yet measured.
  • Audible first-audio latency with the approved local voice has an instrument but no owner-present reading.
  • Mission survival across a full machine reboot has not been proven; a process kill is not accepted as a substitute.
  • Camera frame rate, gesture calibration precision and false activations on the owner’s hardware are still owed.
  • No local language model has been evaluated on the sealed test set, because none passed the development gates.